Edit chart
Loading graph
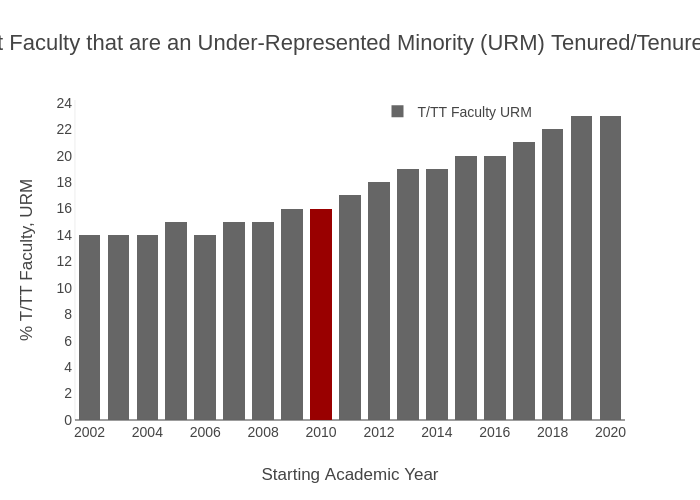
Provostncstate's interactive graph and data of "Percent Faculty that are an Under-Represented Minority (URM) Tenured/Tenure Track*" is a stacked bar chart, showing T/TT Faculty URM vs Baseline T/TT; with Starting Academic Year in the x-axis and % T/TT Faculty, URM in the y-axis.. The x-axis shows values from 2001.5 to 2020.5. The y-axis shows values from 0 to 24.210526315789473.